What is it?
Curriculum mapping is a method which is used to show how individual courses in a program align with the program’s intended learning goals. It is an approach that tags individual courses with specific descriptor data, all of which can then be summarized to illustrate:
- how the program as a whole works
- how the program supports students toward the attainment of the larger program learning outcomes.
This process may reveal gaps or redundancies in a curriculum, identify outlier courses that are disconnected from the program whole, highlight how core or required courses may be over/under-utilized, and draw attention to missed opportunities for utilizing pre-requisites.
Curriculum mapping supports data-informed decision making. Programs can use any descriptor categories they find useful, however, the most typical kinds of data used in curriculum mapping are:
- Level of complexity / depth at which the program outcomes are taught in each course (e.g., introduced, reinforced, proficiency).
- Degree of emphasis / focus each outcome receives in each course (e.g., sporadic, moderate, significant)
- Methods of instruction utilized in each course (e.g., lecture, readings, discussions, CBEL, etc.)
- Methods of assessment utilized in each course (e.g., essays, tests, presentations, etc). Depicted in Figure 4.
- Method of providing feedback to students for each course (e.g., numeric grades, written comments, verbal comments, peers)
How are curriculum maps used and what are some examples?
There are many different questions that curriculum mapping can address. In this section, five curricular questions are explored using curriculum mapping.
Q1. Do we adequately support our students to fully achieve each program outcome?
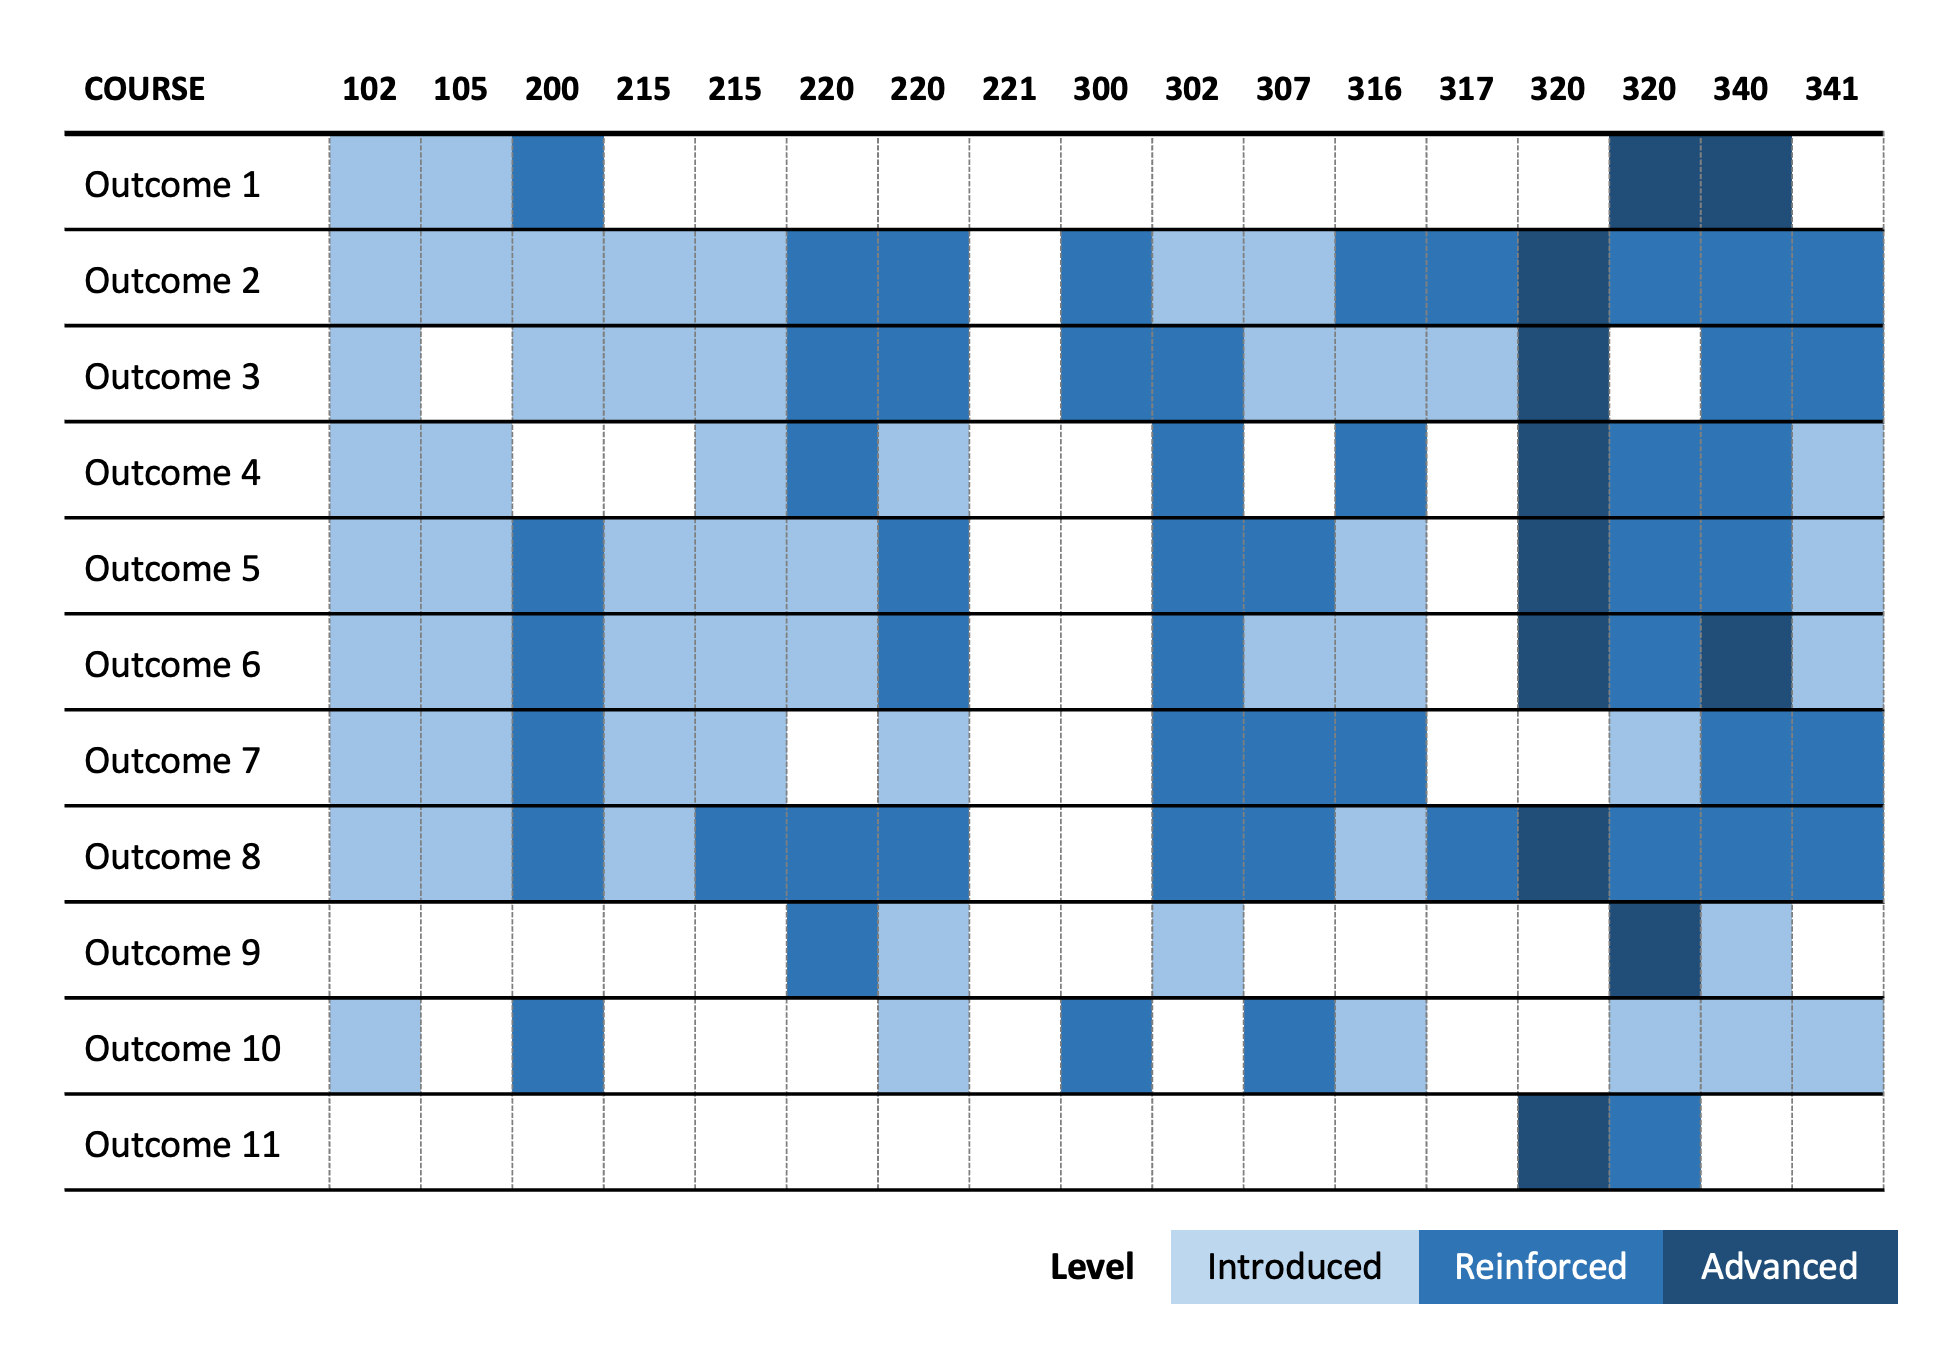
The curriculum map below depicts the level at which a series of program outcomes are taught across a selected group of courses. Level is represented in a three-point scale (introduced, reinforced, and advanced); some questions that one might want to consider about the program based on this data are described below.
Click image to see PDF version
- Outcome 1 has a long time lag between courses that touch on relevant content. As such, the program should discuss if this is appropriate for student learning, or if there needs to be other touch points.
- Outcome 7 falls short of expectations as it is never taught at the advanced level. As such, the program should considering modifying the outcome or deepening course content to another course.
- Outcome 11 does not follow a logical progression as the first time it receives attention is at the advanced level. As such, the program should ensure that students receive proper scaffolding in 320, or adding content to other courses.
- 221 is an outlier course as it does not relate to any outcomes. As such, the program should discuss if this is appropriate as it is meant to cover emergency and special topics, or if the course needs to be redesigned.
- 320 is a critical course for the program as it offers a lot of advanced content. As such, the program should invest in ensuring it has a solid learning design and teaching complement.
Q2. Are students completing critical course work?
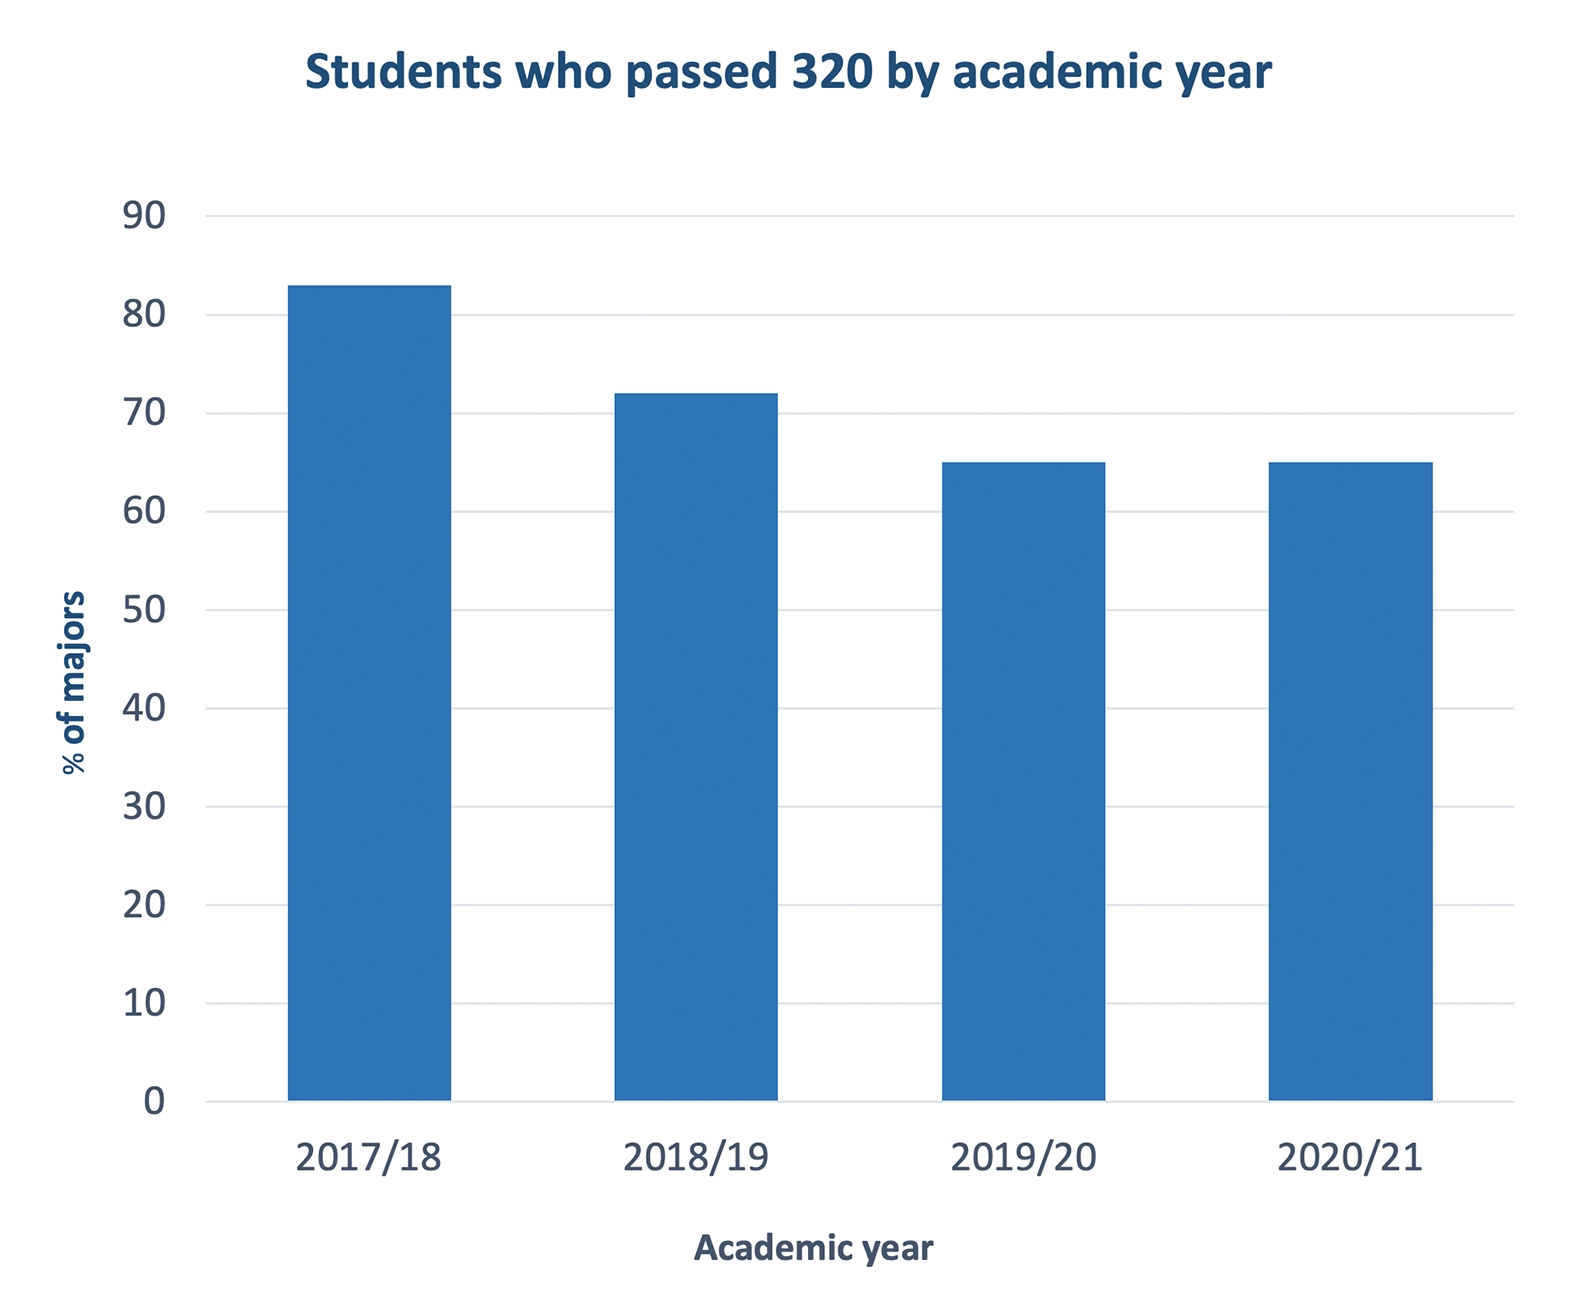
Curriculum mapping can be augmented by cross-referencing courses with enrollment analytics. For example, in the curriculum map above, Course 320 was flagged as a critical course for student learning, and when using enrollment analytics, a bar graph like the one below can be created which depicts the percentage of program majors who have completed that course across four different academic years. By layering enrollment analytics on top of curriculum mapping, we can better understand the way students navigate a program’s coursework and if any program changes are needed to help support students through the curriculum. Potential program modifications for the example below, could include:
- a redesign of 320 or its prerequisite,
- buttressing critical coursework with student advising protocols, or
- developing student support programs such as study teams, tutors, mentors, etc.
Click image to see PDF version
- There is a decreasing trend in completion rate for 320 which is a critical course for attaining the program outcomes. As such, the program might want to gather student feedback to understand barriers to completion and what if program changes are needed.
Q3. Are there retention issues?
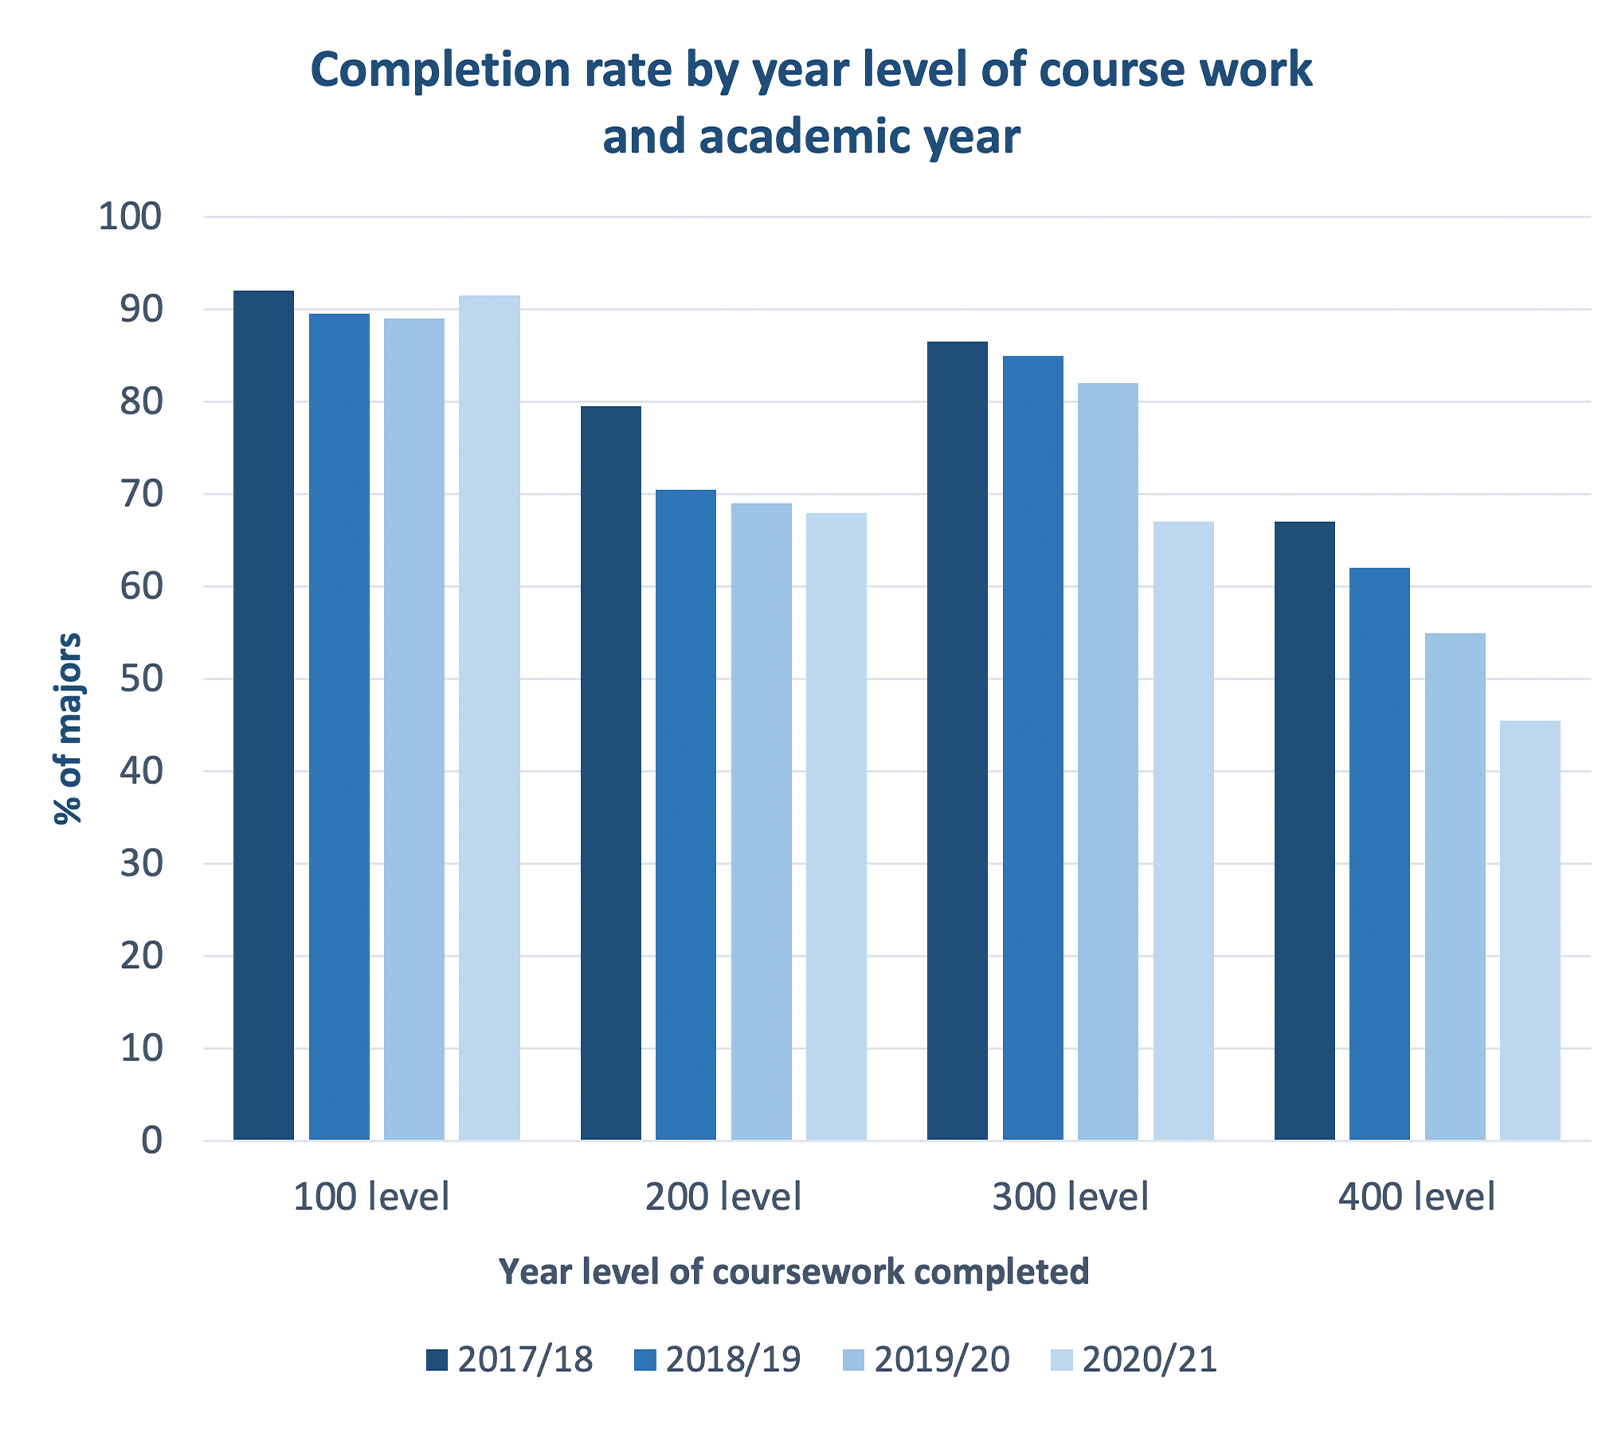
Another way enrollment analytics can be used to understand how students engage with a program’s coursework is by looking at completion rates over time for different year levels of courses. For example, the graph below depicts the percentage of majors completing course work across the 100, 200, 300, and 400 year level for four different academic years. When a sudden drop in completion rate exists (such as that depicted below at the 200 year level), a program might want to consider if any changes were made to the curriculum (e.g. new courses, new faculty, new intake criteria, etc.) and how that may have impacted student retention. For a steady decreasing trend in completion rate (such as that depicted below at the 400 year level), the program might want to conduct student consultations in order to understand barriers to completion.
Click image to see PDF version
- The 2017/18 Academic year saw the highest completion rate of second year coursework. The program might want to consider whether or not any significant changes were made after that year, and if those changes could have student completion.
- There is a decreasing trend in completion rate. The program might want to gather student feedback to understand barriers to completion and what if program changes are needed.
Q4. How are learning and assessment strategies used across the program?
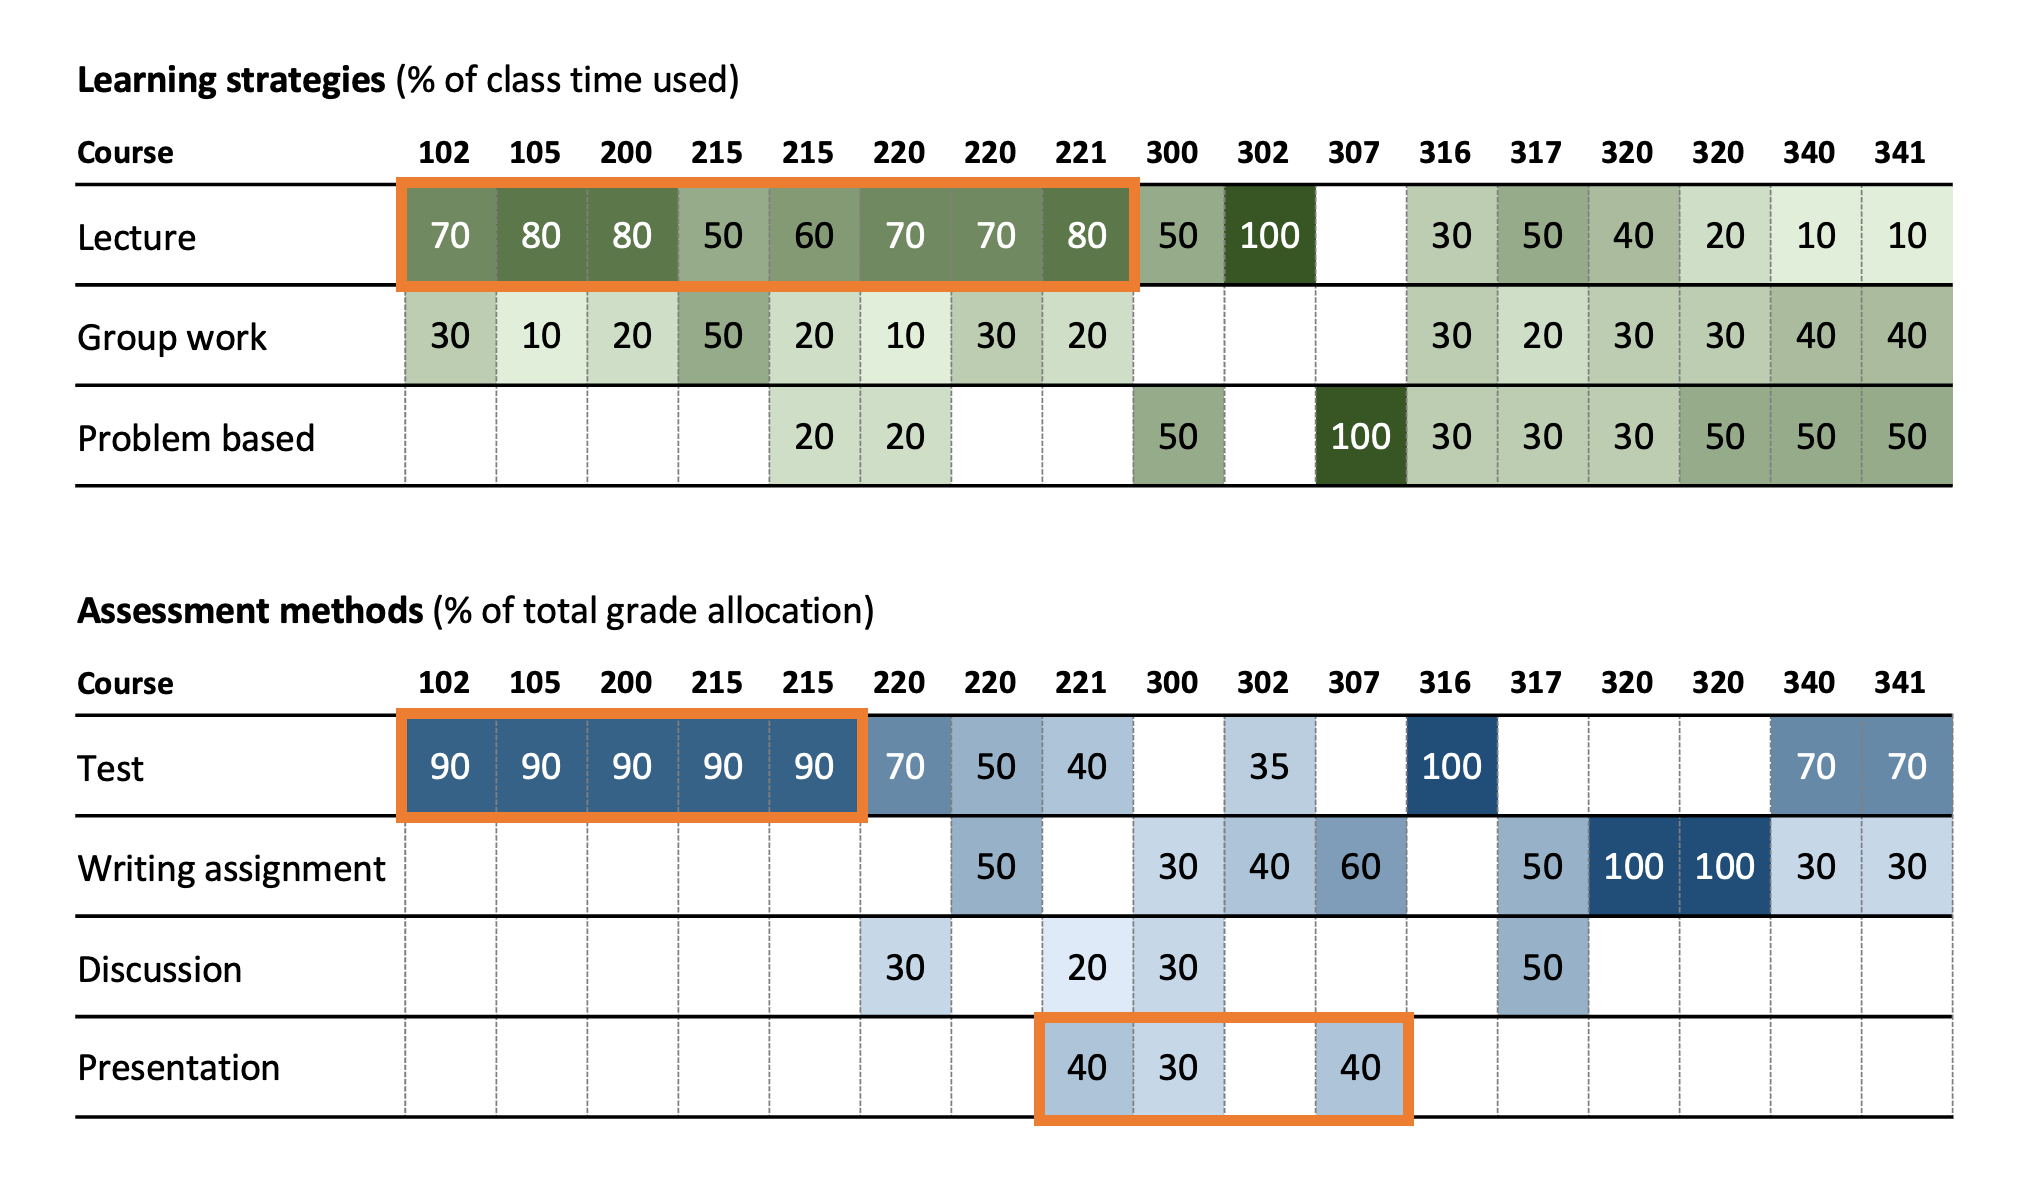
The curriculum map below depicts the learning strategies and assessment methods used across a selected group of courses. The learning strategies are broken down into three types – lecture, group work, problem based – and are depicted in-terms of the approximate percentage of class time used for each type. The assessment methods are broken down into four types – test, writing assignment, discussion, presentation – and are depicted in-terms of the percentage of the final course grade for which each accounts. Some questions the program might need to ask itself based on this data are described below.
Click image to see PDF version
- 1st and 2nd year courses have a large lecturing component. As such, the program might want to discuss if more active learning strategies are appropriate or viable at this level in order to enhance foundational knowledge and retain student enrollments.
- Tests or exams are the core assessment strategy throughout the programs first five courses. As such, the program might want to consider if higher order assessment methods (e.g. writing) might be introduced in junior courses.
- Only three courses use public speaking as part of an assessment strategy. The program might want to review if this is a gap in student training, or if this amount of training in public speaking is aligned with program goals
Q5. Overall, what coverage do program outcomes get across courses?
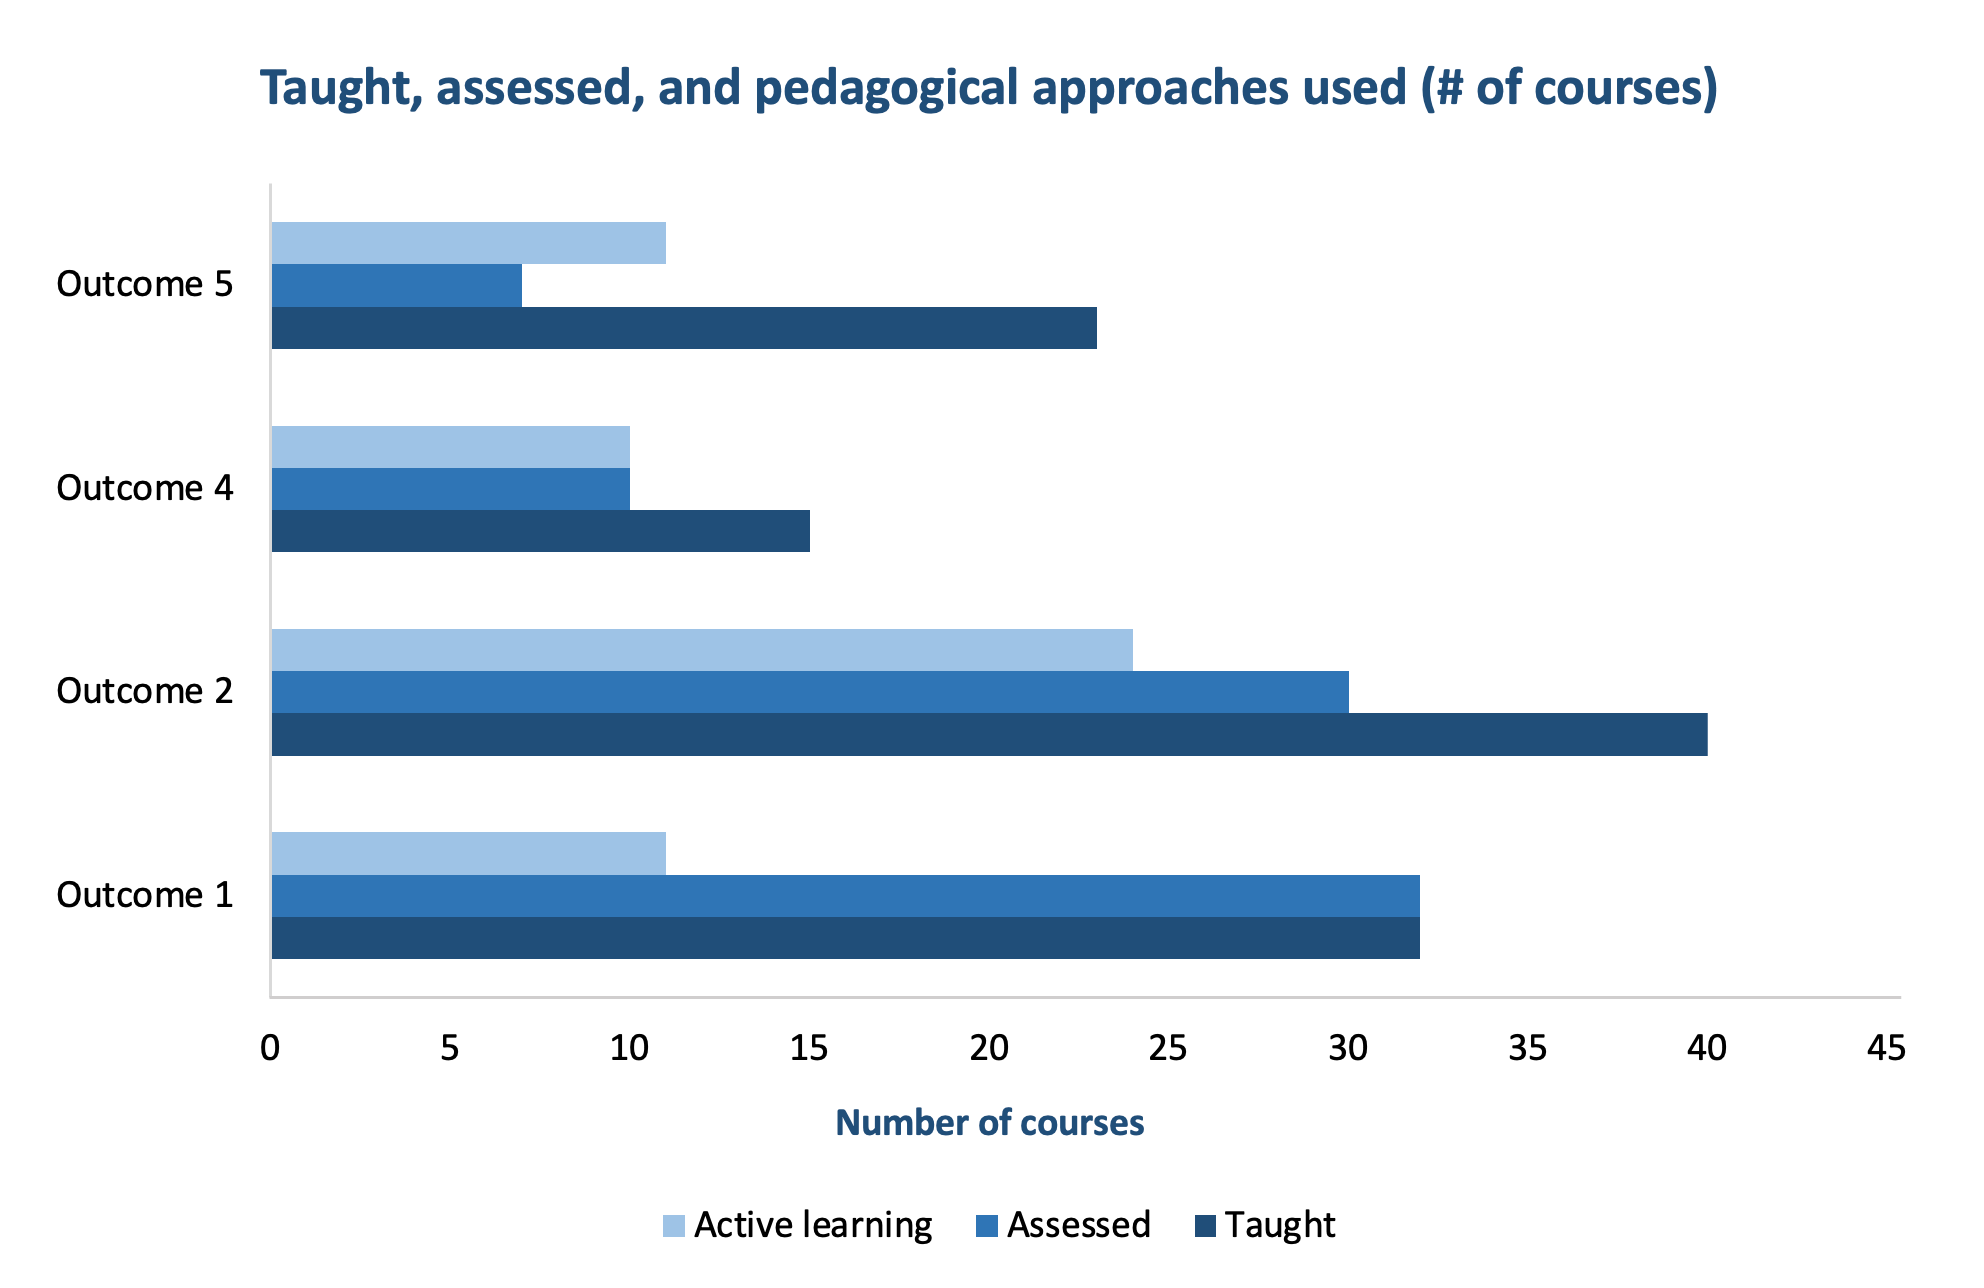
Curriculum mapping can be used to generate aggregate program-level information. For example, the bar graph below depicts within how many courses each program outcome is taught, assessed, and how many courses use active learning strategies to teach those outcomes. At this level, it can be seen quickly which outcomes get the most attention and time across a program’s curriculum. Some questions the program might need to ask itself based on this data are described below.
Click image to see PDF version
- Outcome 4 is only taught in about 15% of the courses. Given this infrequent coverage, if the program wants to ensure that students have enough opportunities to reach this outcome, a sufficient number of those courses should fall within the core requirements.
- Outcomes 1 and 2 receive the most coverage and assessment in the program. Given this extensive coverage, the program might want to discuss if this coverage is appropriate and reflects curriculum priorities, or, if there are redundancies that could and should be replaced with other content.
The above are just four areas you can explore with curriculum mapping. Mapping can also illustrate how specific content and concepts are addressed across a program. Perhaps your unit would like to explore how student workload is distributed across courses, terms and years or when in a term major assignments and assessments are due. The curriculum consultants at CTLT can help you explore all the ways mapping can inform decision making for your program.
How to begin curriculum mapping
There are many ways to approach curriculum mapping. First and foremost you need to identify what curriculum elements you want to map (some examples are below), and with what courses:
- The depth or complexity in which a Program Learning Outcome (PLO) is addressed (e.g. introduction, reinforcement, advanced)
- The degree of emphasis within a course (e.g. sporadic, moderate, significant)
- The core concepts that should be taught across courses and year levels (e.g. theories, methods, central principles)
- The methods of instruction (e.g. lectures, readings, discussions, CBEL, labs, independent)
- The methods of student assessment (e.g.. exam, essays, projects, papers or individual, group or formative, summative)
- The methods of providing feedback (e.g. numeric grades, written comments, peer assessment)
You can collect the needed data via a number of different avenues: faculty survey, faculty interview, student or alumni survey, syllabi review, workshop discussion, etc. There are many tips and tricks to making this a smooth process. To learn more about how to map your curriculum, please reach out to the CTLT’s curriculum and course services team.
